|
Using the General Social Survey dataset, last week I discovered using dummy variables that union members hold higher degrees and more income compared to nonunion members. To expand on that research, I am using a Chi Squares test to examine the relationship between the two variables; respondents’ highest degree (dependent variable) and Does respondent or spouse belong to a union (independent variable). Since both variables are measured as categorical, the Chi-Square test will provide additional insights into the relationship (Frankfurt-Nachmias & Leon-Guerrero, 2018). The results show a p-value of .007, significantly less than the threshold of .05, indicating the rejection of the null hypothesis that union members do not hold higher degrees than nonunion members. Since the Chi-Square test does not reveal the significance of the statistically significant relationship, a Cramer’s V test is used, which results in a value of .074. The Cramer V relationship is between 0 and 1.0, with 1.0 being a strong relationship; thus, in this example, the value of .074 shows a weak relationship between education levels and unionized labor. However, even though the relationship is weak, the dataset does show a statistically significant relationship and therefore, we can assume unionized members earn higher degrees than nonunion members. 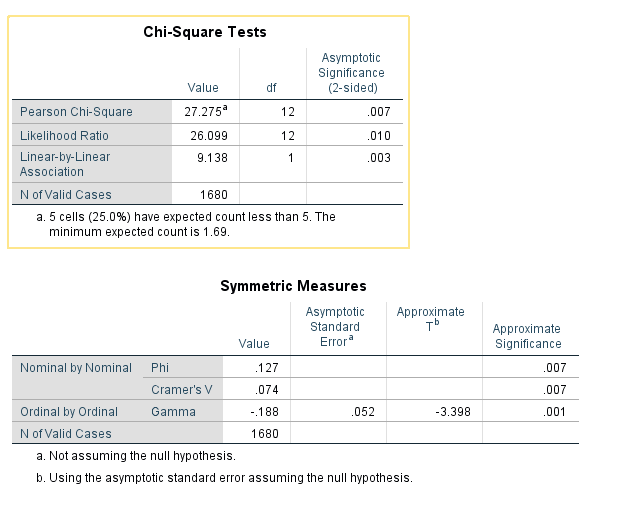 References
Frankfort-Nachmias, C., & Leon-Guerrero, A. (2018). Social statistics for a diverse society (8th ed.). Thousand Oaks, CA: Sage Publications. Laureate Education (Producer). (2016). Bivariate categorical tests [Video file]. Baltimore, MD: Author. span>
0 Comments
Do Americans have a higher Socioeconomic Status (SES) and education level when belonging to a union? I created 3 dummy variables for the independent variable, “Does R (respondent) or spouse belong to a union” using the High School Longitudinal Study dataset. My reference variable assumes that neither the respondent or spouse belong to a union. Further, the model summary indicates 34% of SES values are affected by the independent variables and the ANOVA test reveals a significance level of .000, well below the conventional threshold of .05, indicating unions do influence SES and education levels (Laureate, 2016). 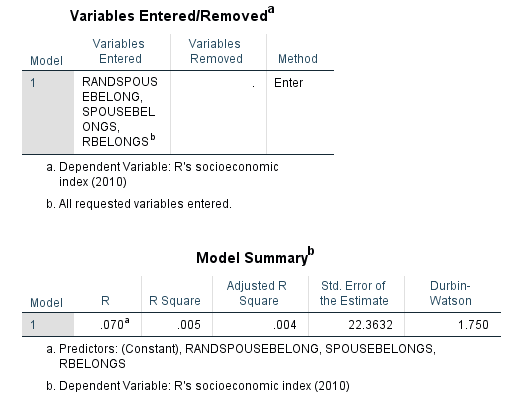 In examining the coefficients, SPSS reveals when comparing SES against married couples who are not in the union, SES increases 2.5 – 2.8 units when one spouse belongs to the union, 2.2 units when both spouses belong to the union. Therefore, when comparing respondents, spouses, or married couples within a union, SES increases and so does their higher education level by 4.245 years. 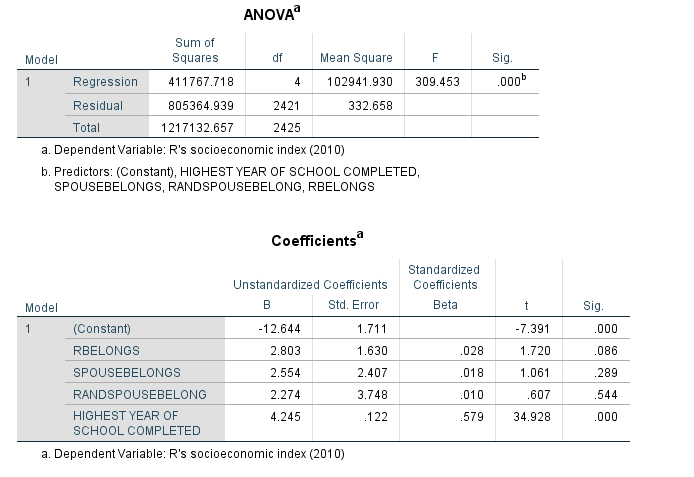 Diagnostics reveals a Durban Watson value of 1.75 and ANOVA value of .008. Further, the collinearity VIF values for each dummy variable are well below 10 at just above 1.0. Lastly, Cooks Distance values are well below 1.0 and do not have undue influence (Laureate, 2.16m). 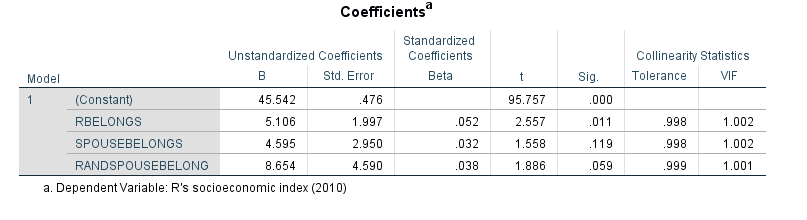 References
Laureate Education (Producer). (2016m). Regression diagnostics and model evaluation [Video file]. Baltimore, MD: Author. Laureate Education (Producer). (2016). Dummy variables [Video file]. Baltimore, MD: Author. |
Dr. Jeremy O'TooleInstructional Technologist Archives
December 2022
|
 RSS Feed
